WEEK 13 (December 5th to December 11th): Labeling Theories, Critical Theories, and Feminist Criminology

Overview

This week we will focus on the last crop of theories. We will begin by focusing on labeling theory. Then, we will proceed in identifying the difference between mainstream and critical criminology. Finally, we will discuss feminist criminology.

The labeling theory will be the first focus of the week. Originating in the mid-to-late-1960s in the United States at a moment of tremendous political and cultural conflict, labeling theorists brought to center stage the role of government agencies, and social processes in general, in the creation of deviance and crime. We will also learn about ideas proposed by John Braithwaite on reintegrative shaming.

The critical perspectives, including conflict criminology, new critical criminology, postmodernism, and radical—Marxist—criminology are discussed. Multiple theories describe the role of the state, political actors, and/or capitalism in creating a culture of conflict.  New critical criminology describes left realism, peacemaking, and postmodernism. Discussion of the critical theories ends with a description of radical or Marxist criminology, which emphasizes the role of capitalism in creating opportunities for crime. Consequently, those of lower socioeconomic status are criminalized to a much greater extent than others.

In this last week of the semester, we will finally focus on feminist theories in criminology. Feminist theories in criminology insist that women’s deviance was worthy of academic inquiry and contributes to our understanding of women as victims, offenders, and practitioners of the criminal justice system. The theories underscore gender differences in crime and present distinct perspectives on feminist criminology including liberal and critical/radical.


Labeling Theories

Learning Objectives

By the end of the week, you will be able to:

  • Discuss primary and secondary deviance.
  • Summarize the foundational ideas of labeling theory.
  • Describe the basic assumptions of labeling theory.
  • Describe reintegrative shaming according to John Braithwaite.
  • Evaluate the research and criticism s of labeling theory.

Workflow

Reading

Chapter 10: Labeling Theory. In Tierney, John. Key Perspectives in Criminology, McGraw-Hill Education, 2009. ProQuest Ebook Central, https://ebookcentral.proquest.com/lib/bmcc/reader.action?docID=480635&ppg=101

Download the chapter here:

Key_Perspectives_in_Criminology_-_10_Labelling_Theory-1

Videos

PowerPoint

an image of number 9

STEP 9: DARE Post-Assessment Due Date December 14th

Dear students,

This is an important post about a required class activity. The course in which you are enrolled is participating in a project funded by the National Science Foundation to improve students’ quantitative literacy skills. As a result of our participation in this initiative, during the semester I am administering two rounds of assessments that focus on quantitative reasoning skills. Your participation in these assessments is a required classroom activity and counts towards attendance/participation. However, you have a choice as to whether or not you want your data to be used for research purposes. Please watch the video here to learn more about this project:

https://tinyurl.com/NSFDARE

In order to receive attendance/class participation credit, you must complete the post-assessment by December 14th. Your participation in these assessments is very important to evaluate the effectiveness of faculty efforts to teach quantitative data analysis. In some classes, students will complete the assessments even if they do not participate in any quantitative literacy activities. In other classes, they will undertake quantitative data analysis.

We ask that you kindly treat the assessments seriously as the results are important for understanding how we can effectively improve our curriculum. Your performance on the assessment has no bearing on your grade in this course and will never be used to evaluate you personally. That said, please try your best, but don’t try to look up answers as that will negatively impact our research.

Meanwhile, you do have the option of deciding whether you want your results to be used for research purposes. Regardless of whether or not you choose to participate in this research, the assessment you complete for class will be the same. However, if you choose to participate in the research, you will be paid $5.00 for your completion of the assessment and you will be asked some additional background questions.

The principal investigators for this project, including Esther Wilder (Lehman College), Rebecca West (Lehman College), and Eduardo Vianna (LaGuardia Community College), would be extremely grateful if you would be willing to allow your data to be used for research. If you choose to do that, the research team will protect the confidentiality of your data. We can only provide compensation ($5) to students who are participants in this research study.

The link for the assessment is here:

https://tinyurl.com/DAREPostAssessmentFall22

Thank you for taking the time to do this!

The DARE Team

Step 7

My revised hypothesis was that the soaring numbers of Larceny-theft crimes affecting my neighborhood will be replicated throughout the country. When conducting research via the F.B.I’s Crime Data Explorer, which utilizes data from the Uniform Crime Reporting system, I learned the rate of larceny theft has actually been decreasing in both my home state of New York, and the entire United States. As you will see below:

In addition to this, I learned that the rate of Larceny-thefts in New York State have been on par to the rates of the United States. With the way both rates head in the same downward direction, I’m predicting that before 2024, the two rates will meet at nearly the same point.

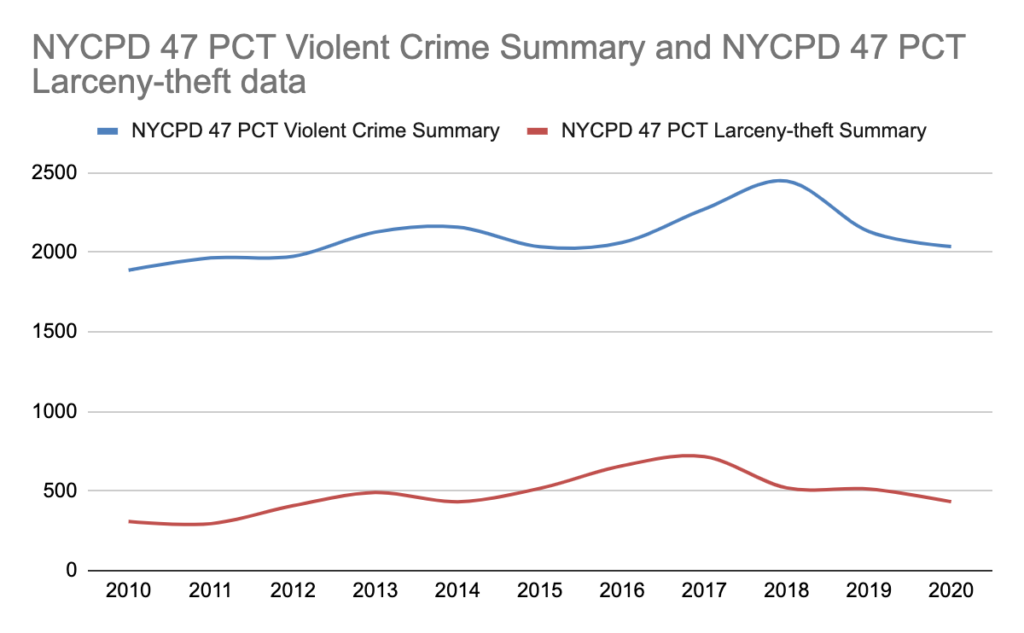
Other than the F.B.I’s CDE, I also utilized the NYCPD’s historical crime data to research the larceny thefts of my local precinct (the 47th), and I was shocked. While I couldn’t calculate the rate since i couldn’t gain the specific population of NYC from 2010 – 2020, I found the raw numbers of both total violent crimes and larceny-thefts reported at the 47th precinct, and compared them as below:

Taking a step further, I calculated the percentage that Larceny-theft makes up out of the total violent crime reported in the 47th precinct and found a high point of approximately 31.95% in 2016.

With the results of my research, I realized that I proved myself wrong. The soaring numbers of Larceny-theft crimes affecting my neighborhood are actually a part of a bigger study, one that proves that the Larceny theft in New York is decreasing like literally never before.

Step 6-Justin Chavez

https://docs.google.com/spreadsheets/d/1YjRhm4Td5wS–us_k-S1OqJCc71SWe6_kA-ntQXXdRM/edit?usp=sharing

The data presented for my neighborhood surprised me a bit as I did not expect the population of white people to have decreased significantly over the years, since most of my neighbors are white. But I did assume this because most of the people in my area are Hispanics or Asian which is interesting as both races share a similar population percentage. Apart from that, what really caught my eye was how crime was relevantly common in the past; which makes me wonder what caused the crime levels to decrease.

Step 7

My research question focuses on how we can make the homicide rate go down in neighborhood like Bedford-Stuyvesant that belongs to the 81st precinct.

After collecting data from the FBI UCR, and the NYPD 81st precinct I was able to make a graph and show how the homicide rates in the United States and New York City measure next to each other.

The chart above shows data collected from 2001-2020. In the chart we can see how the homicide rate in NYC follows the U.S homicide trend. Starting in 2001 homicide trend in both the U.S and NYC decreased slightly and then around 2003 it went up again. From 2006 to 2016 the homicide trend decreased and increased every year and we never had a steady homicide trend. After 2016 the homicide trend the trend decreased again but in 2019 it went up by a lot, and it will keep increasing.

In the graph above it shows the homicide trend in the 81st precinct from 2001-2020. From 2001-2015 the homicide rate for the precinct chosen above it shows how the homicide rate was in a steady trend for a few years and then in 2019 it went below 0.69 and then it increased again.

The data shown will still leave us with some answered questions such as ” why is the homicide trend in NYC following the U.S trend in homicides and it is not following its own trend”.

Step 7

My research question focused on when, in the previous ten years, the larceny crime rate in the 122nd Precinct reached its lowest point.

After collecting data from the FBI UCR, NYPD, and precinct-level data I was able to gather evidence that the least amount of larceny was committed in 2020, as shown in the graph below.

The chart depicts data collected from 2011 to 2020. We can see that there was a significant increase in 2012, with 3275,849628 crimes per capita. Starting in 2018, crime rates began to fall, and 2020 has been the year with the lowest number of larceny crimes in the 122nd precinct. Nonetheless, the records appear concerning due to their large number. In comparison to national data for larceny crime, we can see in the graph below that the one from the precinct level is significantly higher.

Such a graph allows us to see how concerning the 122nd precinct’s documentation is, while also comforting to see it decreasing overall with national and state data beginning in 2018/2019.

The collected data also enables us to follow larceny crime data in the United States and New York State, separated by precinct, in order to expand or improve our future research.

The data points still leave us with some unanswered questions, such as “What was the cause of so many crimes in 2011?” and “What factors contributed to its decrease on a national and local level beginning in 2018?”

Submit your paper

Step 8

Step Eight: Draft of the Research Report (Due 12/7) 

Draft a five-page research brief research report that formalizes your CRJ 102 DARE Project research results and experience. Address the following: 

  • Your research question – what was it and why did you choose it? 
  • Your hypothesis – what was it and why did you settle on it? 
  • Your data sources.
  • Your data analysis process – describe how you analyzed the data from your research question. 
  • Present the table and graph. How did you construct each? What are the dimensions/axis and components of each? How does each help you to both answer and present your research question and findings?
  • Your written analysis. What does the data reveal? Was your hypothesis correct or incorrect? Why do you think it was/wasn’t so? What do your findings mean? What theory could be helpful in explaining the results? 
  • Describe your experience using the Google Suite to collect, analyze, and present sociological data. How easy/difficult was that experience? What did you like/dislike about it? 
  • How would you describe your quantitative reasoning skills (and confidence in those skills) prior to your participation in this course? How would you describe them now?

Share your draft in the OpenLab reflecting on the bullet points above. Offer feedback to at least two of your classmates’ reports.  

Grading Rubric

18 – 20 15 – 1712 – 149 – 1110 and lower
ThesisClearly stated and appropriately focused.Clearly stated by focus could have been sharper.Thesis phrasing is too simple lacks complexity, or is not clearly worded.Thesis lacks a clear objective and/or does not fit the content of the paper.Thesis is not evident.
Tables/GraphsTables and graphs are properly formatted and labeled, and are free of quantitative errors.The tables and graphs are mostly correct, but there are a few errors.Tables and graphs have several errors.Tables and graphs have numerous errors.Tables and graphs are missing or problematic.
Data AnalysisClear and insightful descriptions and interpretations of the data that are statistically and logically correct. The data are correctly interpreted, but thoughtful insights are absent.There are mistakes in data interpretations or insights.The errors in interpretation are numerous. The data have not been analyzed or interpreted. 
OrganizationThe paper has an informative title. It is broken down into coherent sections and subsections with informative titles. The paper has an informative title. It is broken down into sections.
The paper has an informative title. The paper isn’t not clearly broken down into sections. 
The paper does not demonstrate clear organization, the title is missing. 
Absence of planned organization. 
Style and LanguagePrecise and effective word choice and style. Generally correct grammar, spelling, and punctuation.Minimal mistakes in grammar, spelling, and punctuation.Several awkward and/or unclear sentences; problems with word choice.No apparent control over sentence structure and word choice. 

Completing this assignment will help you achieve the student learning outcomes required in a 100-level criminology class. It will also contribute to developing your capacity for clear, cogent, and well-organized writing, a capacity that is useful to acquire whatever career you’ll end up embarking on. Finally, your participation in the DARE program will contribute to developing your capacity for qualitative reasoning for understanding data and interpreting tables and graphs.