Category Archives: Student Work

step 6 re upload

NYU Furman center New York deals with the neighborhood data profiles, by viewing and
downloading the neighborhood indicators. They provide more information in-depth about the
demographics, housing market and the land use. Those indicators helps use in understanding the
local housing, demography trends, identify the customers’ needs and policy making.
Considering the financial district, in 2019, demographics show that there were 164, 514
individuals in the district. Out of the number, 13.8% were Asians, 3.4% were black, 11.4% were
Hispanic and 68.4% were White. That explains that majority of individuals were white and the
least were black.
There were different household groups in the financial district. The group with highest share in
2019 was $ 100, 001-$250,000 with 36.7%. Also, in 2020 it had largest share but at a slight
lower percentage of 34%.The poverty level in the financial district was 6.1% compared to the
16% of the citywide.
The real rent gross median point in the district increased from $2,330 in the year 2006 to $ 2,930
in 2019. In the year 2019, the percentage of the renter households that were at rent burden was
16.6% (most of the renters spent 50% of their income on the rent only). In the same year the
vacancy rate in the district was 4.7%.
The house ownership rate in the citywide was 31.9% in 2019 compared to 31.6% in the financial
district. There has been an increase of 6.3% in the house ownership rate in the neighborhood
since 2010. There were 9.3% mortgage that was introduced per 1000 1-4 property of the family
and the condominium units.
Security is very important in every surrounding. The serious crime rate was 16 crimes per 1000
residents in 2021 in comparison with 12.2 crimes per 1000 residents citywide.

Overall Relation to Dare Project

Drug abuse resistance education is a given program that seeks to prevent use of the controlled
drugs, violent behavior and membership in gangs. It’s my expectation that the crime rate in the
financial district would go down past the citywide. Also, it will be great if discrimination as per
race would end to reduce the stigma among the children.

STEP 5 RE UPLOAD

USA-Alaska Crime Data Comparison

Student name: Kieon Holder 

Student ID: 30508632

Advantages and disadvantages of official crime data:

Official data is the set of numerical data and the government and also the agencies of government collect this data. Official data is a form of quantitative data at the secondary level and from surveys at a large scale, official data is collected. In sociological research official statistics is used. Whereas the non-official crime data numerically collect data from both the organization such as from public as well from private organizations. 

Cost, as well as time, can also be saved by the official statistics and these can be accessed easily. Official statistics also give a good overview of the present society. Fairly the collection of data is due to stringent rules on a survey and it is easy for sociologists in identifying the trends.

Whereas there are some disadvantages of official data such as the official data being a social construction. The researcher cannot collect the data for which they are looking.  As this is called secondary data and the researcher doesn’t know how the original data will be collected.

Insights of the crime data compared in a spreadsheet

In the given data, in Alaska in 2013 and 2014 agencies of the state submitted the data according to the definition of UCR but after the full transition in 2021 and changes and transition of Uniform Crime Reporting (UCR)to NIBRS ( National Incident-Based Reporting System) whereas for the agencies the deficiency of data and that is not completely transitioned.

Further, rape data in 2013 & 2014 in Alaska were collected and submitted by the state’s agencies according to the latest definition explained by the UCR whereas, in 2013, in the USA’s crime data, the data related to the rape cases were collected and submitted according to the both the latest definition provided and the original definition launched by the UCR. Moreover, in 1995, 168 murders and other kinds of homicides that came into effect due to the bomb blast of “The Alfred P. Murrah Federal Building in Oklahoma City” are also considered while making the national estimate. Further, in 2001, 2823 murders and other homicides were not included in the national data which came into effect due to an event that happened in September 2001 (Crime Data Explorer, n.d.). 

Further, in the spreadsheet, I’ve shown the weapons used in the crimes made in USA and Alaska which shows that most crimes happened by using personal weapons. The second most used weapon in resulting crimes in the USA is the handgun whereas most crimes in Alaska resulted from using no weapon. This data also helps in identifying and reaching the murderer.

Related to the overall DARE project

This portion of the project will be very helpful in the completion of the overall DARE project as this will provide useful insights about the crimes that happened in the USA and Alaska. Further, this will also help me get further data required and use them in my further projects. I got a verified and trusted source of information to get data in more detail.

References:

Crime Data Explorer. (n.d.). Retrieved from https://crime-data-explorer.fr.cloud.gov/pages/explorer/crime/crime-trend

Step 7

My revised hypothesis was that the soaring numbers of Larceny-theft crimes affecting my neighborhood will be replicated throughout the country. When conducting research via the F.B.I’s Crime Data Explorer, which utilizes data from the Uniform Crime Reporting system, I learned the rate of larceny theft has actually been decreasing in both my home state of New York, and the entire United States. As you will see below:

In addition to this, I learned that the rate of Larceny-thefts in New York State have been on par to the rates of the United States. With the way both rates head in the same downward direction, I’m predicting that before 2024, the two rates will meet at nearly the same point.

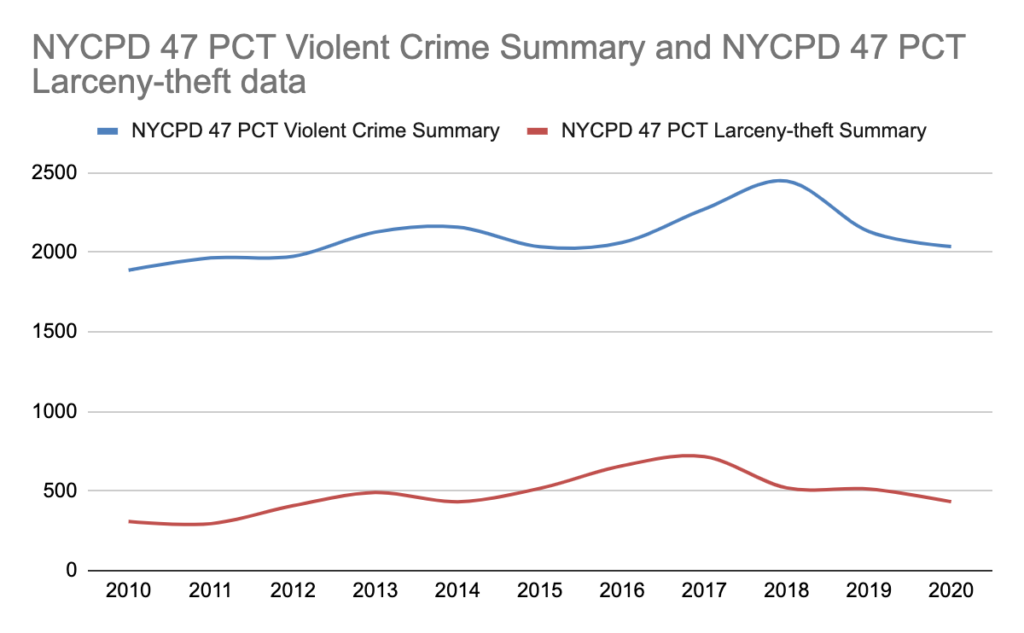
Other than the F.B.I’s CDE, I also utilized the NYCPD’s historical crime data to research the larceny thefts of my local precinct (the 47th), and I was shocked. While I couldn’t calculate the rate since i couldn’t gain the specific population of NYC from 2010 – 2020, I found the raw numbers of both total violent crimes and larceny-thefts reported at the 47th precinct, and compared them as below:

Taking a step further, I calculated the percentage that Larceny-theft makes up out of the total violent crime reported in the 47th precinct and found a high point of approximately 31.95% in 2016.

With the results of my research, I realized that I proved myself wrong. The soaring numbers of Larceny-theft crimes affecting my neighborhood are actually a part of a bigger study, one that proves that the Larceny theft in New York is decreasing like literally never before.

Step 6-Justin Chavez

https://docs.google.com/spreadsheets/d/1YjRhm4Td5wS–us_k-S1OqJCc71SWe6_kA-ntQXXdRM/edit?usp=sharing

The data presented for my neighborhood surprised me a bit as I did not expect the population of white people to have decreased significantly over the years, since most of my neighbors are white. But I did assume this because most of the people in my area are Hispanics or Asian which is interesting as both races share a similar population percentage. Apart from that, what really caught my eye was how crime was relevantly common in the past; which makes me wonder what caused the crime levels to decrease.

Step 7

My research question focuses on how we can make the homicide rate go down in neighborhood like Bedford-Stuyvesant that belongs to the 81st precinct.

After collecting data from the FBI UCR, and the NYPD 81st precinct I was able to make a graph and show how the homicide rates in the United States and New York City measure next to each other.

The chart above shows data collected from 2001-2020. In the chart we can see how the homicide rate in NYC follows the U.S homicide trend. Starting in 2001 homicide trend in both the U.S and NYC decreased slightly and then around 2003 it went up again. From 2006 to 2016 the homicide trend decreased and increased every year and we never had a steady homicide trend. After 2016 the homicide trend the trend decreased again but in 2019 it went up by a lot, and it will keep increasing.

In the graph above it shows the homicide trend in the 81st precinct from 2001-2020. From 2001-2015 the homicide rate for the precinct chosen above it shows how the homicide rate was in a steady trend for a few years and then in 2019 it went below 0.69 and then it increased again.

The data shown will still leave us with some answered questions such as ” why is the homicide trend in NYC following the U.S trend in homicides and it is not following its own trend”.

Step 7

My research question focused on when, in the previous ten years, the larceny crime rate in the 122nd Precinct reached its lowest point.

After collecting data from the FBI UCR, NYPD, and precinct-level data I was able to gather evidence that the least amount of larceny was committed in 2020, as shown in the graph below.

The chart depicts data collected from 2011 to 2020. We can see that there was a significant increase in 2012, with 3275,849628 crimes per capita. Starting in 2018, crime rates began to fall, and 2020 has been the year with the lowest number of larceny crimes in the 122nd precinct. Nonetheless, the records appear concerning due to their large number. In comparison to national data for larceny crime, we can see in the graph below that the one from the precinct level is significantly higher.

Such a graph allows us to see how concerning the 122nd precinct’s documentation is, while also comforting to see it decreasing overall with national and state data beginning in 2018/2019.

The collected data also enables us to follow larceny crime data in the United States and New York State, separated by precinct, in order to expand or improve our future research.

The data points still leave us with some unanswered questions, such as “What was the cause of so many crimes in 2011?” and “What factors contributed to its decrease on a national and local level beginning in 2018?”

STEP 7- Yuhai

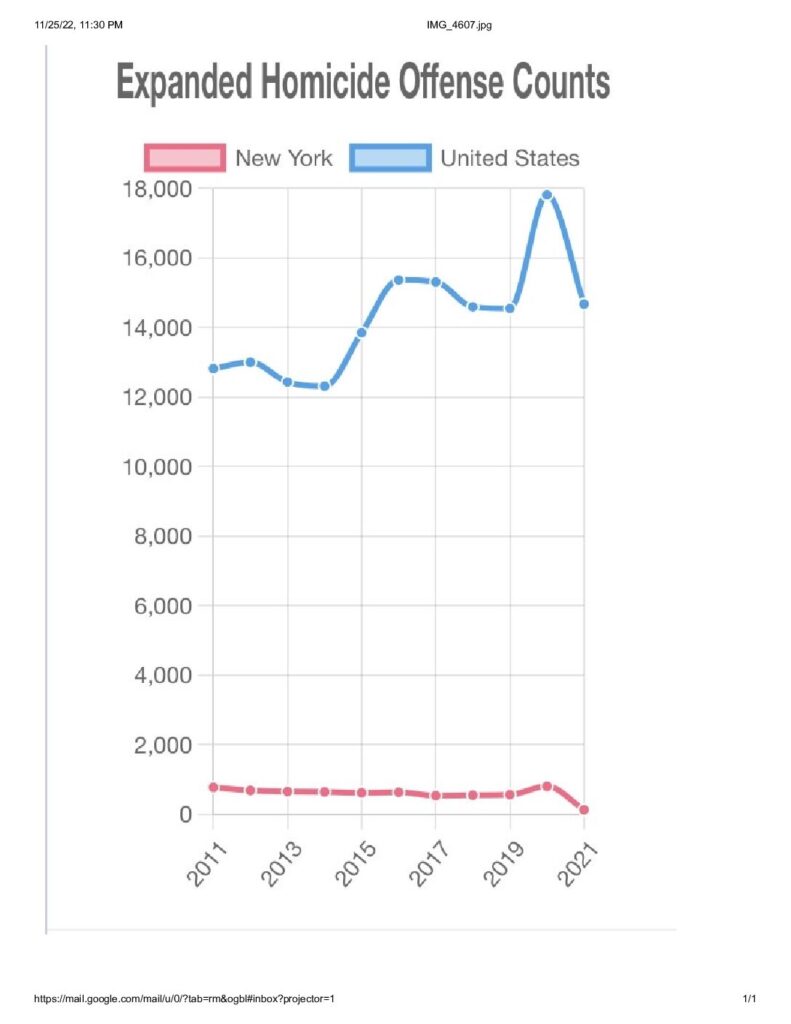
My research question concerned the homicide rate in New York from 2010 to 2021. It got decreased from 2010 to 2017. But from 2018 to 2020 it increases back up again.

My data come from FBI UCR data and Precint level data.

Here is the graph of homicide trend data from New York

Trend of Homicide from 2010 to 2021

2021 Expanded Homicide Data includes fewer homicides due to an overall decrease in participation from agencies that are not yet reporting via NIBRS.

Expanded Homicide Data

you can see from 2019 to 2021 it has a big drop on it

Step Seven – Kevin Chango

Research Question and Hypothesis

Does my research question the homicide rate between 2000 and 2021 increase or decrease in the 104th precinct? My Hypothesis is the homicide rate will be higher in District 104 than in the other districts, for it is a larger neighborhood than the others.

My data come from FBI UCR data and the precinct-level data

Here is a graph of homicide trend data for precinct 104th

The year with the most homicides is 2009, with nine homicides. It was the highest level compared to the year 2020 when there was a range of zero homicides.

Graph of homicide trend data on the United States and New york

Diagram of homicide trend data Comparate as the United States, New York, and 104th Precinct

I was very surprised with the results of the statistics because I thought for being a precinct that covered part of Queens and Brooklyn, they would have more homicides, but I can see that the only two years that had an increase in homicides was in 2000 with 6 and in 2004 with 4 this means that Ridgewood is not a very quiet neighborhood since in 2020 there were none compared to the other neighborhoods they reach an increase of 10 or more.

Step 5

https://docs.google.com/spreadsheets/d/1txudN4V5-5pIk-WWSczjmSR-pg0MX1Rt7c7zy5F2aCc/edit?usp=sharing

It is interesting that by observing the grand larceny crime statistics data you can see how the national statistics have gone down quite a lot but when seeing the state crime statistics it has gone down but not much. I tried observing the data from my precinct but the only data available is outdated. It goes to show we need to prioritize tracking the rates of certain crimes so people can observe the trends.

Step Seven – Luis Vasquez

https://docs.google.com/spreadsheets/d/1-j_9ZXjRuFD–u8y2ku7xU8jMiKrhorwGI8-sjQVrFU/edit?usp=sharing

What is the rate of homicide from the past decade into the present in The Bronx that belongs to the 44th precinct? Does the statistics increased or decreased? There was a rising in homicide in the 44th precinct Bronx, NY but is still low than homicide trends in the United States. I thought that the homicide numbers in my precinct will be kind of high compared to the United States trends because of the crime that happens daily I was kind of surprised to look at this data because there is a lot of crime around my neighborhood, and I thought that it would be higher. I think that the advantage of official crime data is that you get to know how safe your neighborhood is compared to others and even the whole united states. 

This graph shows the homicide rate in New York.

Since the year 2000, homicides in the state of New York have decreased a lot, but as of 2020, we can see how homicides have increased again.

Homicide trend data in the United States compared to New york.

New York State’s murder rate has maintained a much lower murder rate compared to the entire United States. In this same graph, you can see how from 2020 the homicide rate has increased again both in the United States and in New York.

This graph compares the homicide data trend from 2000-2020 in the United States, New York, and the 44th precinct.

The graph and data table gives me a better understanding of how rates can change depending on what type of crime you are looking at, the years, and the places. By looking at the charts I understand better how homicides in New York are compared to the whole United States and is easier for to me look at a graph instead of looking at all the numbers in the data table.