https://docs.google.com/spreadsheets/d/1vreqiXHwkWTvL_qqaLCt9fYb0H28NQKn1lms8v6kP10/edit?usp=sharing
Research question and hypothesis
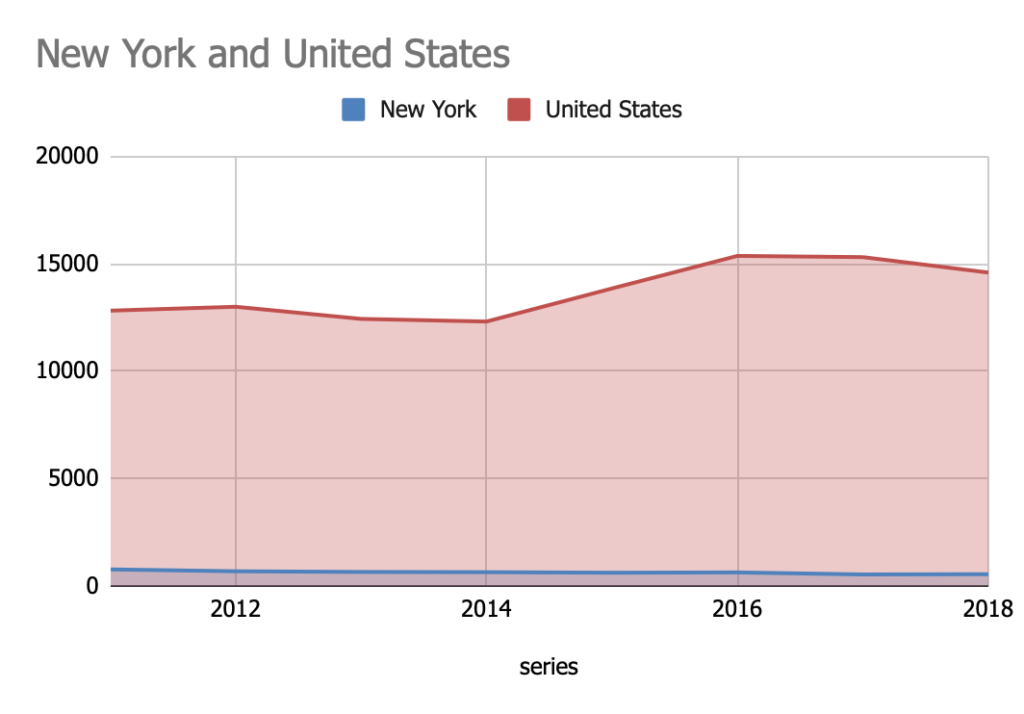
Does my research question the homicide rate between 2012-2022 increase in the 81st precinct as time went by ? Based on my hypothesis it would consistently go up and down. So from 2012 to 2018 it increased and from 2019 to 2020 it increased then went back down from 2020 to 2021.
My data came from the FBI UCR data and the 81st precinct.
Here is a graph

The year with the most homicides is 2011 with 769 and from the years 2011 to 2021 it was the highest level and 2021 had the lowest with 124.

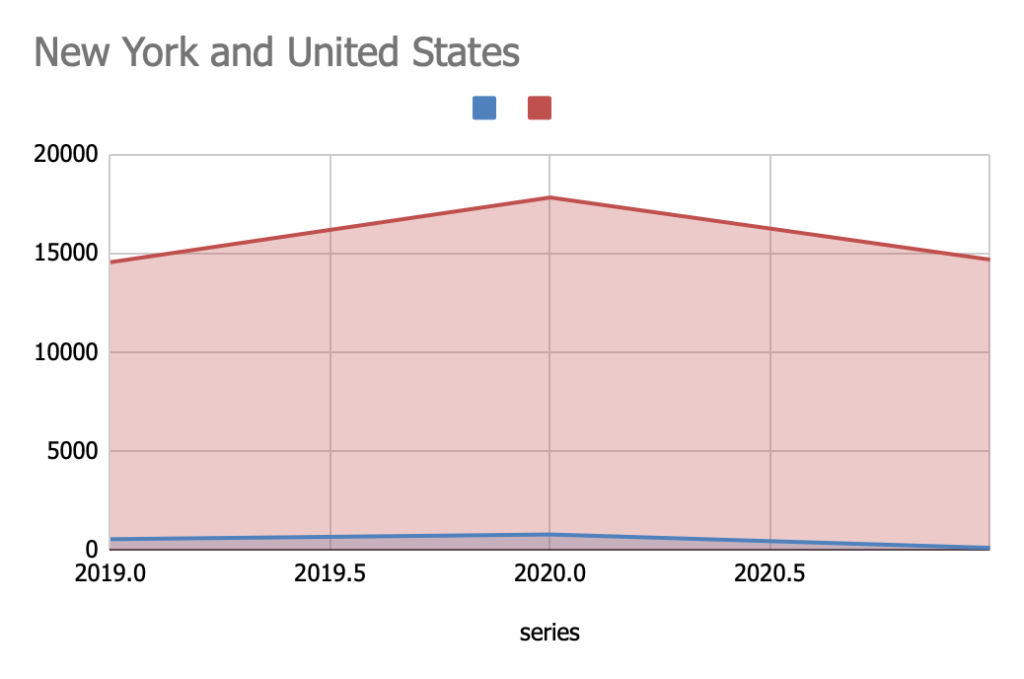
Another graph on the homicide trend from 2019 to 2021 it decreased a lot especially from 2020 to 2021.
I was surprised with the results because with New York crime rates extend everyday and in the neighborhood of Brooklyn there’s more crimes than in other parts in New York. With the homicide rates the data that was collected would consistently change a lot.
There is an issue with your second graph. Let’s take a look at it tomorrow.