BMCC OpenLab
Home
Members
Courses
Portfolios
Communities
Clubs
Projects
About
Help
My OpenLab
Home
Members
Courses
Portfolios
Communities
Clubs
Projects
About
Help
Sign Up
Log In
Skip to main content
Mat 150 Introductory Statistics
Toggle mobile menu
[ Course Profile ]
Home
About This Class
Instructor
Schedule
Course Information
Course Materials
Assignments
Assignment 1
Assignment 2
Assignment 3
COVID-19
Tutorials
Tutorial 1
Tutorial 2
How to Flatten the Exponential Curve?
Extra Credit 1
R Notes
R and .csv file
Frequency Tables Using R Part 1
Frequency Table Using R Part2
Posts
COVID-19
Search for:
Search
Home
»
COVID-19
Recent Posts
How to Flatten the Exponential Curve?
COVID-19
Frequency Table Using R Part2
Frequency Tables Using R Part 1
Uploading a .csv file into R
Recent Comments
excel Dashboard navigation
on
Assignment 2
COVID-19
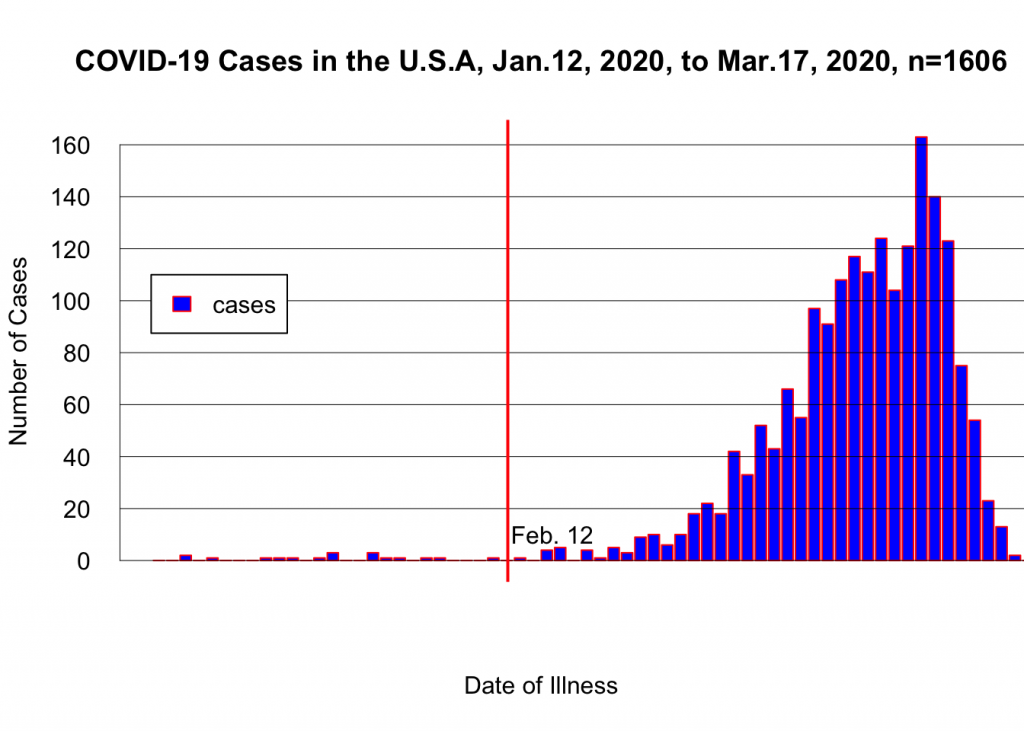
COVID-19 Assignment
The data uploaded from www.cdc.gov used for the construction of this graph excludes cases among persons repatriated to the U.S.A from Wuhan, China, and Japan.
Assignment
Identify
statistical W’s
, namely: WHO, WHAT, WHEN, HOW.
Describe this plot in words using full and complete sentences while paying attention to the left-tail distribution, center, and
right tail
.
Contextualize description using phrases such as
data suggest …
,
it appears that …
.
No opinion, please.
Recent Comments