How Do We Construct A Frequency Distribution Table Using R? Part 1
We will use States Visited, (StatesV) variables included in the first-day class survey, Sur1.
- Upload Sur1.csv data set from your desktop to R
Sur1 <-read.csv("~/Desktop/Sur1.csv")NOTE: In case you did not save Sur1.csv file correctly to your desktop, execute the following code
Sur1 <-read.csv(read.csv(file.choose(),header = TRUE))
- Examinne the strucure of Sur1 data set
str(Sur1)## 'data.frame': 20 obs. of 6 variables:
## $ SEX : Factor w/ 2 levels "Female","Male": 1 1 1 1 2 2 2 1 1 1 ...
## $ POLITICS : Factor w/ 3 levels "Conservative",..: 3 3 3 3 3 3 2 2 1 3 ...
## $ NSiblings: int 4 4 2 2 2 4 5 4 4 1 ...
## $ StatesV : int 5 11 6 3 7 3 4 4 6 3 ...
## $ ShoeS : num 6 9 8 7.5 13 10.5 9 8 6 8.5 ...
## $ UsedExcel: int 2 2 2 1 1 3 3 2 2 1 ...- View first six row of the data in spreadsheet format
head(Sur1, 6)## SEX POLITICS NSiblings StatesV ShoeS UsedExcel
## 1 Female Moderate 4 5 6.0 2
## 2 Female Moderate 4 11 9.0 2
## 3 Female Moderate 2 6 8.0 2
## 4 Female Moderate 2 3 7.5 1
## 5 Male Moderate 2 7 13.0 1
## 6 Male Moderate 4 3 10.5 3- Attach Sur1 to R in order to work with data variables without using $ symbol (remember to detach(Sur1) after completion of analysis)
attach(Sur1)- Summarize StatesV variable
summary(StatesV)## Min. 1st Qu. Median Mean 3rd Qu. Max.
## 3.00 4.00 6.00 7.15 9.50 18.00- Construct a frequency distribution table of States Visited using breaks to list class limits
breaks <-seq(0,18, by=3)- Group StatesV variable data into bins
StatesV.cut <-cut(StatesV,breaks)- Construct frequency table for StatesV variable in horizontal display
table(StatesV.cut)## StatesV.cut
## (0,3] (3,6] (6,9] (9,12] (12,15] (15,18]
## 3 8 4 3 1 1- Transform this table to 2-column display
transform(table(StatesV.cut))## StatesV.cut Freq
## 1 (0,3] 3
## 2 (3,6] 8
## 3 (6,9] 4
## 4 (9,12] 3
## 5 (12,15] 1
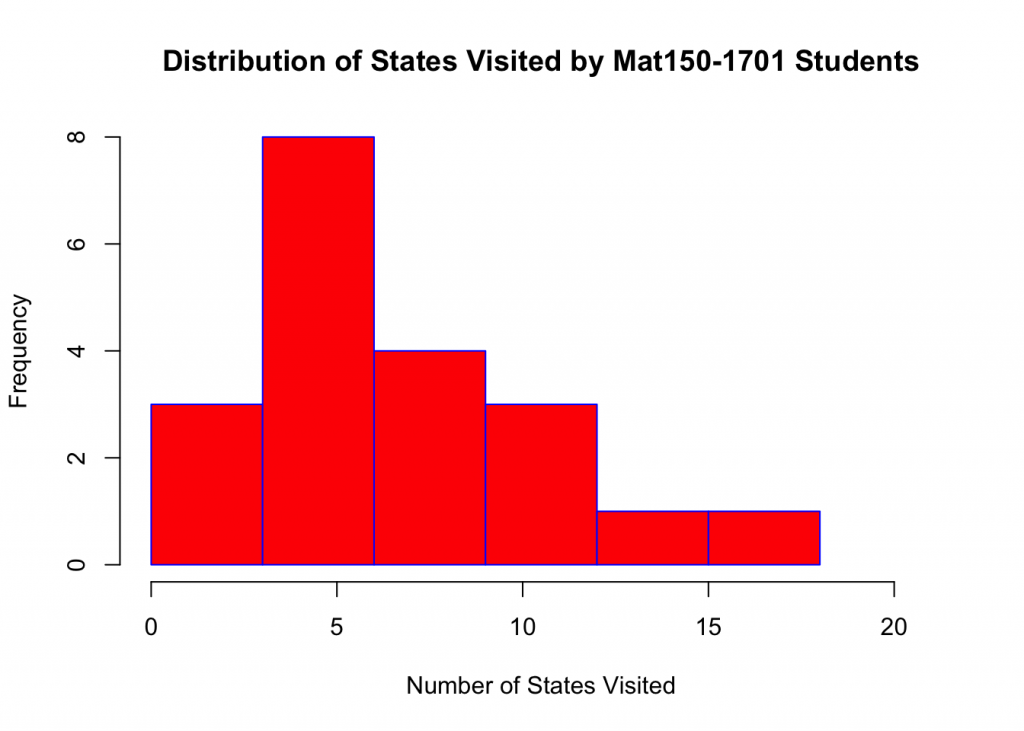
## 6 (15,18] 1- Construct a histogram of the frequency distribution of StatesV variable
hist(StatesV,breaks,col="red",border = "blue",xlab="Number of States Visited",xlim = c(0,21),ylab="Frequency",main="Distribution of States Visited by Mat150-1701 Students")