Sampling Distribution of Sample Mean
Example 1 (Data Set 21)
- Upload Data Set 21 to R in previously saved .csv format.
- Use Data Set 21 to construct a histogram of DEPTHS of 600 earthquakes.
- Select 10000 random samples of size=50 from the DEPTHS variable, calculate the mean of each and construct a histogram of the sampling distribution of the sample means.
SOLUTION
EarthQ <- read.csv("~/Desktop/csv/21 - Earthquakes.csv")attach(EarthQ)head(EarthQ)## MAGNITUDE DEPTH
## 1 2.45 0.7
## 2 3.62 6.0
## 3 3.06 7.0
## 4 3.30 5.4
## 5 1.09 0.5
## 6 3.10 0.02. breaks <-seq(0,45,by=5)
hist(DEPTH,breaks, col="red",xlab = "Depth [km]",ylab = "Frequency",main = "Histogram of Earthquakes Depths")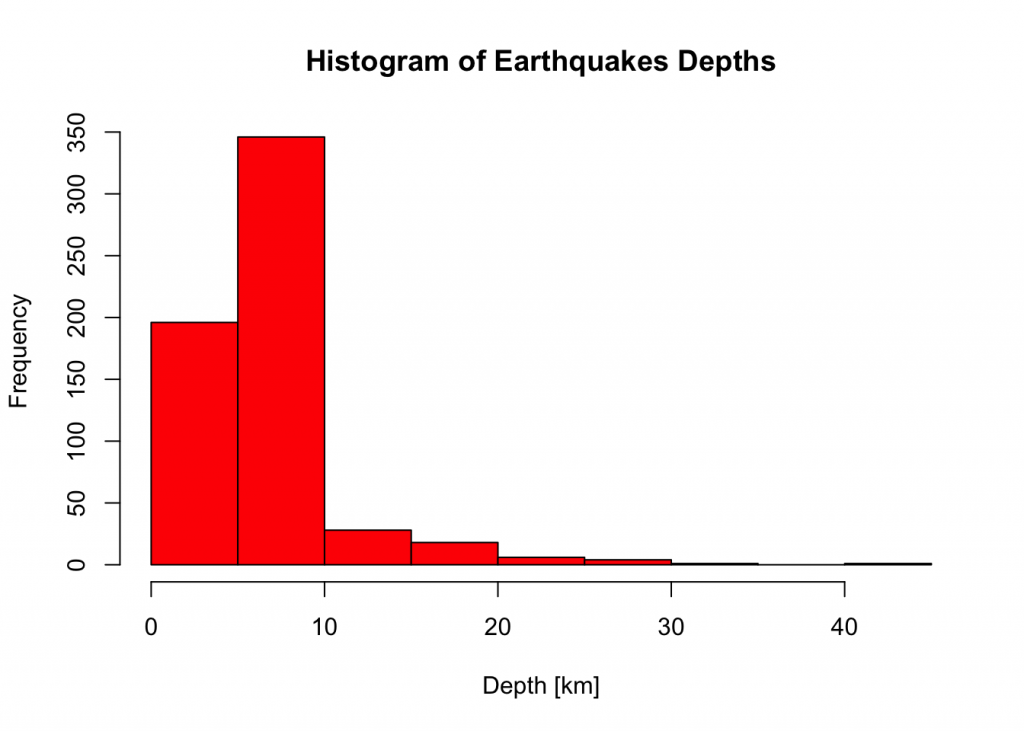
mean(DEPTH)## [1] 5.822sd(DEPTH)## [1] 4.927049fifty.depths <- function() {
depth.S <- sample(DEPTH,
size = 50,replace = TRUE)
return(mean(depth.S))
} sim1 <-replicate(n=10000,expr=fifty.depths())head(sim1)## [1] 5.540 6.576 5.224 6.800 5.262 4.952summary(sim1)## Min. 1st Qu. Median Mean 3rd Qu. Max.
## 3.650 5.338 5.798 5.825 6.270 8.742sd(sim1)## [1] 0.695623breaks <-seq(2.5,10.5,by=0.5)
hist(sim1,breaks,xlab ="Mean[km]",ylab="Frequency",col="red",border = "green",main="Sampling Distribution of the Sample Mean")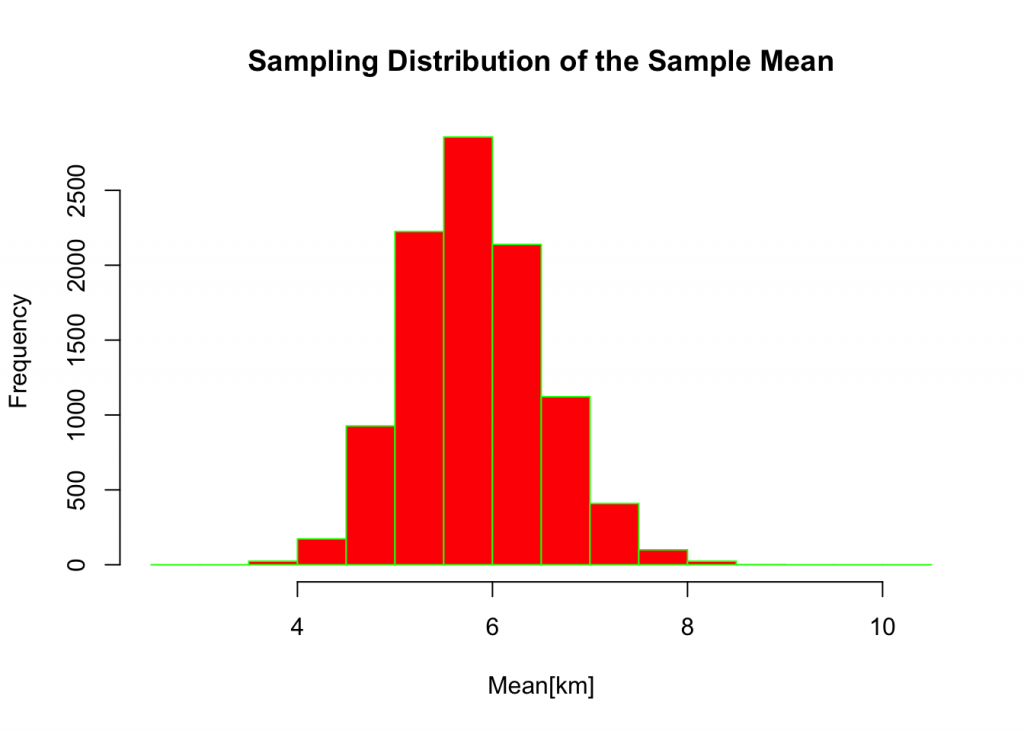
Things to ponder:
- the shape of DEPTH histogram
- values of the mean(DEPTH) and sd(DEPTH)
- shape of means(DEPTH) sampling distribution
- values of the mean of the sampling distribution and standard deviation of the sampling distribution
Recent Comments