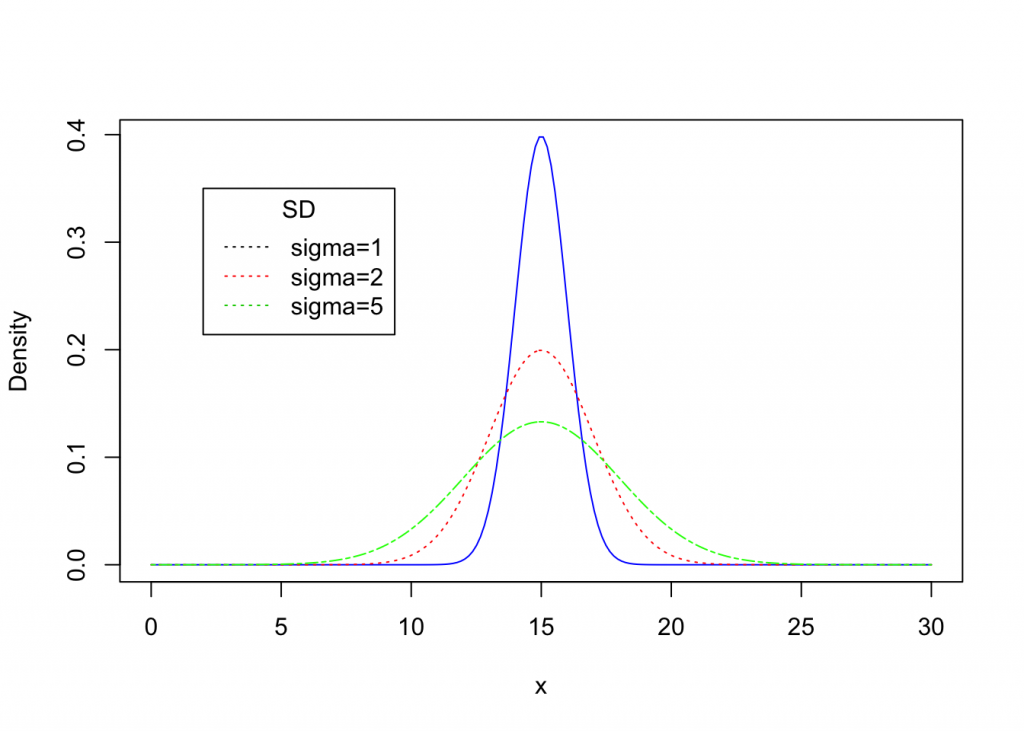
Nonstandard Normal Distributions
Here are nonstandard density curves with a mean equal to 15 and various standard deviations.
Model Problem1
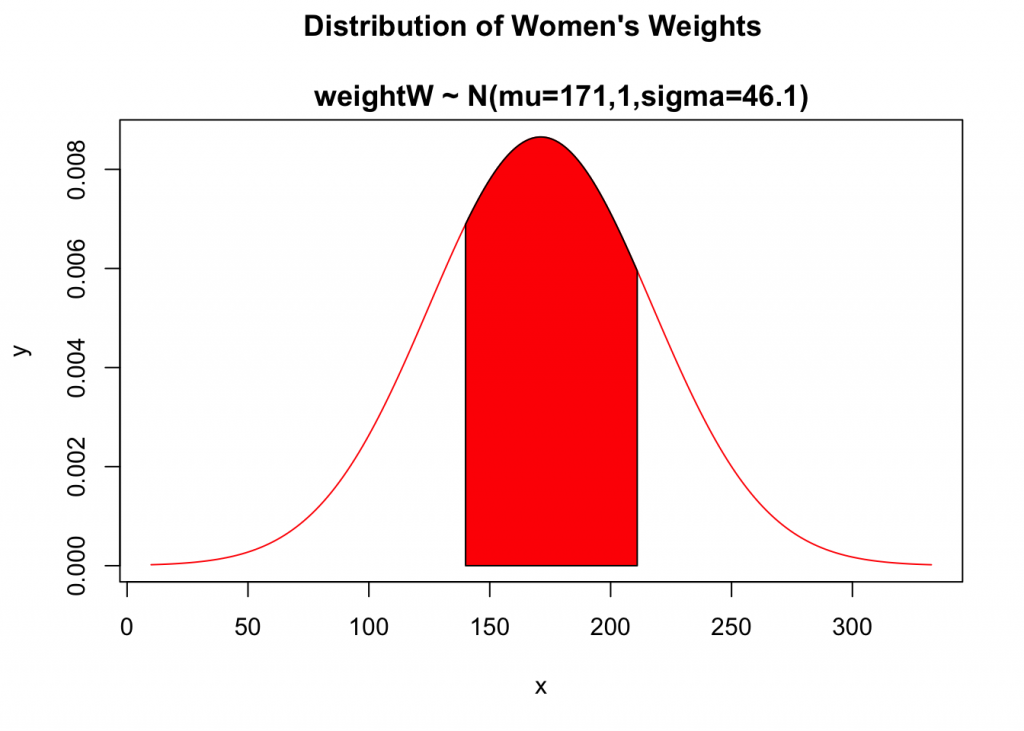
U.S. Air Force once used ACES-II ejection seats designed for men weighing between 140 lb and 211 lb. Given that women’s weights are normally distributed with a mean 171.1 lb and a standard deviation of 46.1 lb (based on data from the National Health Survey), what percentage of women have weights that are within those limits? Were many excluded from those past specifications?
Model Solution when Using z-tables
Given: Distribution Statement: heightW ~ N(mean = 171.1lb.,sd = 46.1lb.) and heightW boundaries: 140lb and 211lb
Objective(s): a. The proportion of women’s heights within the boundaries.
b. Were many women excluded from those past specifications?
Solution Plan
1. We will sketch and label nonstandard distribution of women’s heights, (heightW) and include distribution statement as its title.
2. Next, we will calculate z-scores for the boundaries and determine the area under density cure within these limits.
3. Finally, we will provide a written statement regarding obtained results.
1. Solution
Lower boundary: x=140
Upper boundary: x=211
2. Model solution when using z-tables
Now we will convert boundaries x=140 and x=211 to respective z-scores:
x = 140 corresponds to z = -0.67
x = 211 corresponds to z = 0.84
The area under the density curve within the limits is found from z-table it is equal to 0.5564. The cumulative area under both tails is 1 – 0.5564=0.4436
3. Statements about obtained results
3a. Just about 55.64% of women met past weight requirements.
3b. About 44.00% of women were excluded from past weight specifications.
Model Solution when Using R for Calculations
For part a. we will use: pnorm(x,mean,sd) code in the following way:
pnorm(211, mean=171.1, sd=46.1)-pnorm(140,mean=171.1, sd=46.1)## [1] 0.556662For part b we will use: code, 1- the previous answer:
1-0.556662## [1] 0.443338However, we may use more fancy code, (cut/paste) as follow:
1 -(pnorm(210, mean=171.1, sd=46.1)-pnorm(140,mean=171.1, sd=46.1))## [1] 0.4493441Assignment 3
Extra Credit: #29 and #33 from page: 252-253. Note: Follow model solution, part; (1), (2), and (3) in order to obtain full credit.
Extracted from M.F Triola, Essential s of Statistics Sixth Edition, Pearson. Essentials of Statistics page: 252, #27↩
- Extracted from M.F Triola, Essential s of Statistics Sixth Edition, Pearson. Essentials of Statistics page: 252, #27↩