This week we will be focusing on control theories. They are quite prominent in modern criminology. We will discuss the old and new versions of control theories.
We are still working on Step 7th. I have seen a number of submissions. I feel that I need to have a meeting with each one of you whether or not you submitted a Step 7. Fill out this survey so we can arrange a time to meet: https://forms.gle/R7UW5h5zmtZQCWWEA
I have office hours today from 1:00 pm to 2:00 pm on Zoom. I also have office hours tomorrow from 9:45 am to 10:45 am. But as I told you last week, with the registration for Spring 2023, I have been busy advising during my office hours. So, use the survey above to let me know when you would like to meet outside of office hours.
This week we will focus on social control theories. These theories assume everyone has the desire to commit criminal and deviant acts and seeks to answer why some people refrain from doing so. Control theories assume that all people would naturally commit crimes if not for restraints on the selfish tendencies that exist in every individual. The theories are concerned with explaining why individuals don’t commit crimes or deviant behaviors. Others claim that there are internal mechanisms (such as self-control or self-conscious emotions, such as shame, guilt, etc.), but even those are likely a product of the type of environment in which one is raised.
Lesson Objectives
By the end of this week, you will be able to:
Identify the central question of the social control theories.
Discuss early models of social control theories.
Identify the four bonds proposed by Travis Hirschi.
Describe how a low level of self-control leads to delinquency and criminality, based on the General Theory of Crime.
My research question concerned the homicide rate in New York from 2010 to 2021. It got decreased from 2010 to 2017. But from 2018 to 2020 it increases back up again.
My data come from FBI UCR data and Precint level data.
Here is the graph of homicide trend data from New York
Trend of Homicide from 2010 to 2021
2021 Expanded Homicide Data includes fewer homicides due to an overall decrease in participation from agencies that are not yet reporting via NIBRS.
Expanded Homicide Data
you can see from 2019 to 2021 it has a big drop on it
Does my research question the homicide rate between 2000 and 2021 increase or decrease in the 104th precinct? My Hypothesis is the homicide rate will be higher in District 104 than in the other districts, for it is a larger neighborhood than the others.
My data come from FBI UCR data and the precinct-level data
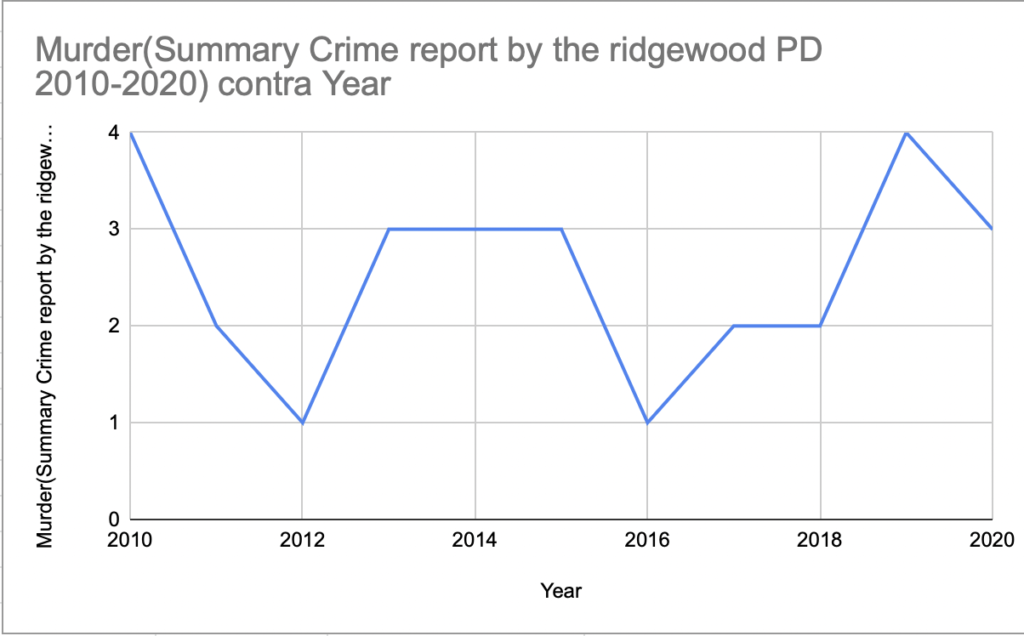
Here is a graph of homicide trend data for precinct 104th
The year with the most homicides is 2009, with nine homicides. It was the highest level compared to the year 2020 when there was a range of zero homicides.
Graph of homicide trend data on the United States and New york
Diagram of homicide trend data Comparate as the United States, New York, and 104th Precinct
I was very surprised with the results of the statistics because I thought for being a precinct that covered part of Queens and Brooklyn, they would have more homicides, but I can see that the only two years that had an increase in homicides was in 2000 with 6 and in 2004 with 4 this means that Ridgewood is not a very quiet neighborhood since in 2020 there were none compared to the other neighborhoods they reach an increase of 10 or more.
It is interesting that by observing the grand larceny crime statistics data you can see how the national statistics have gone down quite a lot but when seeing the state crime statistics it has gone down but not much. I tried observing the data from my precinct but the only data available is outdated. It goes to show we need to prioritize tracking the rates of certain crimes so people can observe the trends.
On Tuesday, let’s focus on Step 7. I will go over it again to make sure everyone submits the assignment by the end of the week.
I will have my regular office hours today at 1 pm and on Tuesday from 9:45 am to 10:45 am. These days, I am also available on ZOOM: https://bmcc-cuny.zoom.us/j/3772687009
What is the rate of homicide from the past decade into the present in The Bronx that belongs to the 44th precinct? Does the statistics increased or decreased? There was a rising in homicide in the 44th precinct Bronx, NY but is still low than homicide trends in the United States. I thought that the homicide numbers in my precinct will be kind of high compared to the United States trends because of the crime that happens daily I was kind of surprised to look at this data because there is a lot of crime around my neighborhood, and I thought that it would be higher. I think that the advantage of official crime data is that you get to know how safe your neighborhood is compared to others and even the whole united states.
This graph shows the homicide rate in New York.
Since the year 2000, homicides in the state of New York have decreased a lot, but as of 2020, we can see how homicides have increased again.
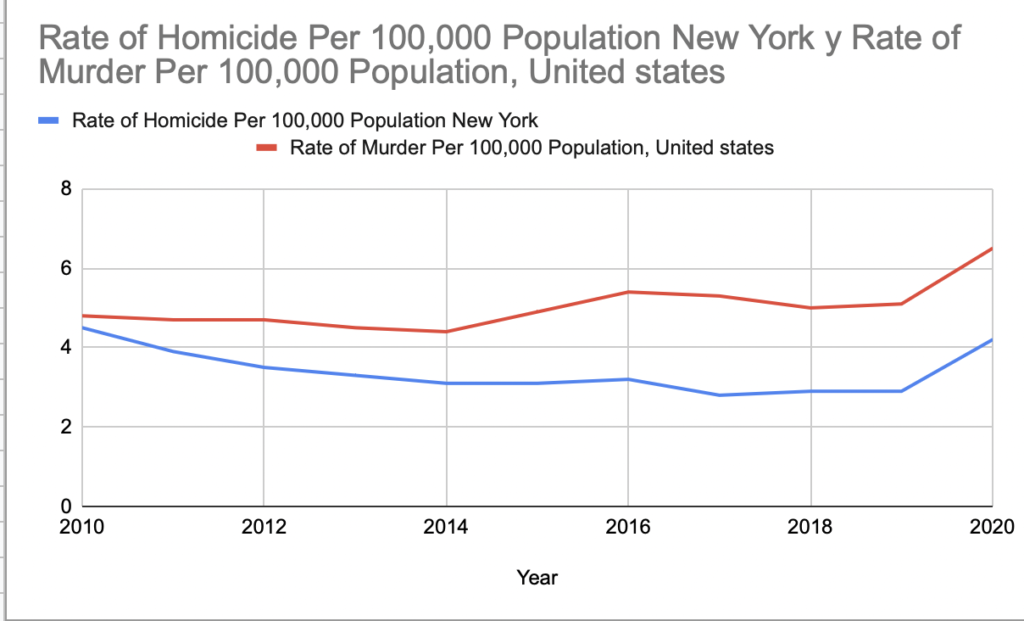
Homicide trend data in the United States compared to New york.
New York State’s murder rate has maintained a much lower murder rate compared to the entire United States. In this same graph, you can see how from 2020 the homicide rate has increased again both in the United States and in New York.
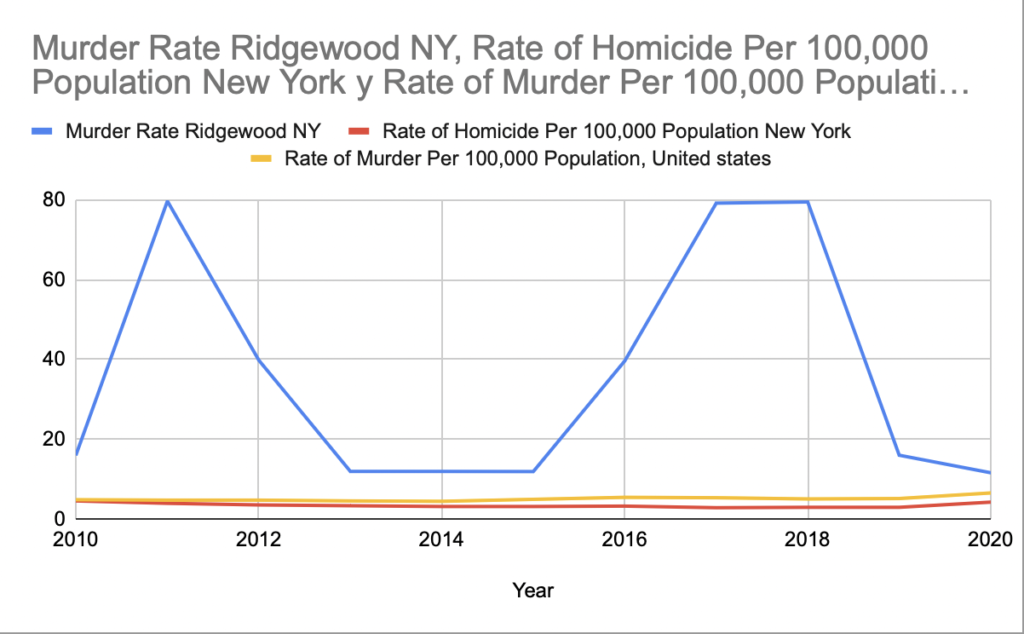
This graph compares the homicide data trend from 2000-2020 in the United States, New York, and the 44th precinct.
The graph and data table gives me a better understanding of how rates can change depending on what type of crime you are looking at, the years, and the places. By looking at the charts I understand better how homicides in New York are compared to the whole United States and is easier for to me look at a graph instead of looking at all the numbers in the data table.
This table help me understand a little more about how the rates are very variable depending on the place and the time. Is very important when you try to have the data about something and these is more organized. The graph help too much because is easier understand and reading the data because you can see and you can’t confused in that, this graphs help you so much understand the percent, the figures and all. It’s very impressive to see how is the difference between the two crimes that I selected, exit a lot difference that the difference is too much and I never imagined how could this change every year and two years ago and how the murder was decreased two years before 2020. I think my hypothesis was supported 50% because I thought the murder can decrease as the years pass, and yes that happens but no too much so that’s why. But I really impressed about the data.