Category Archives: Student Work

STEP SEVEN- Maria Moran

https://docs.google.com/spreadsheets/d/15i9vDWImS8eqTcNouPpG_08q7W0Z2So1wMx8G1a-hwg/edit?usp=sharing

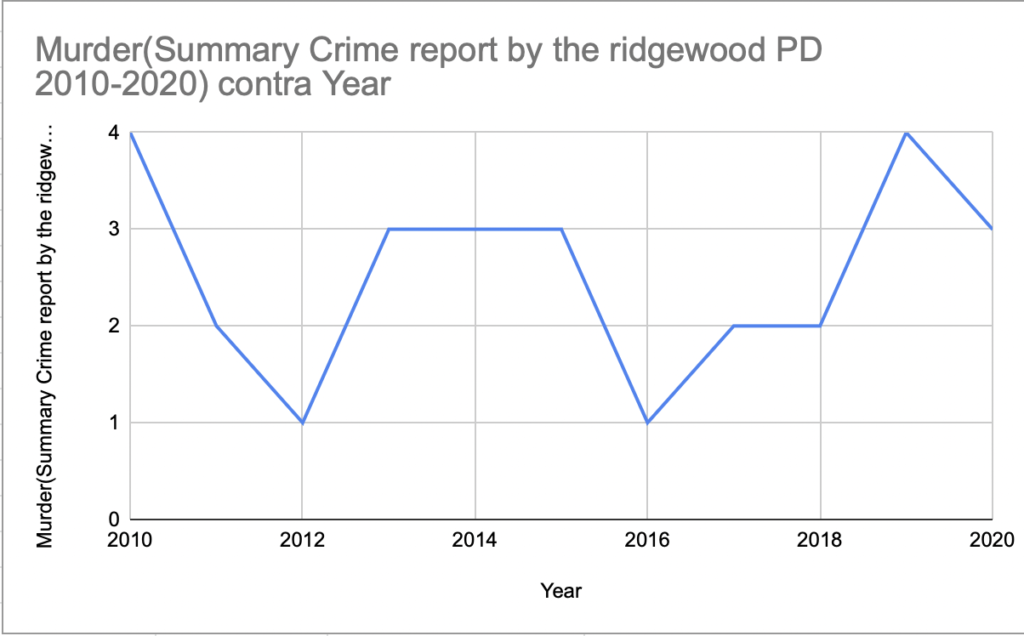
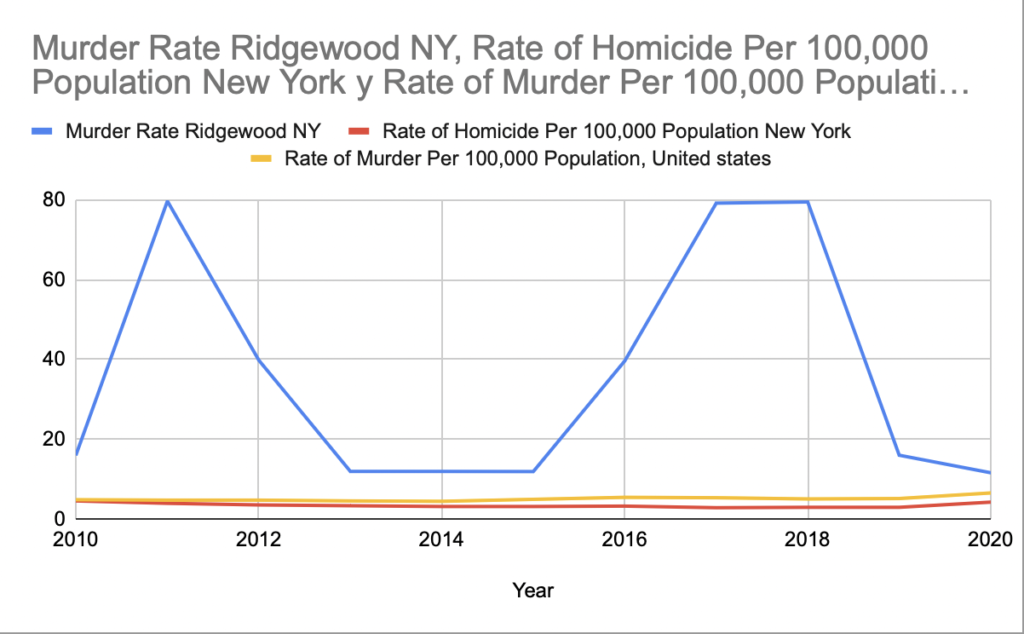
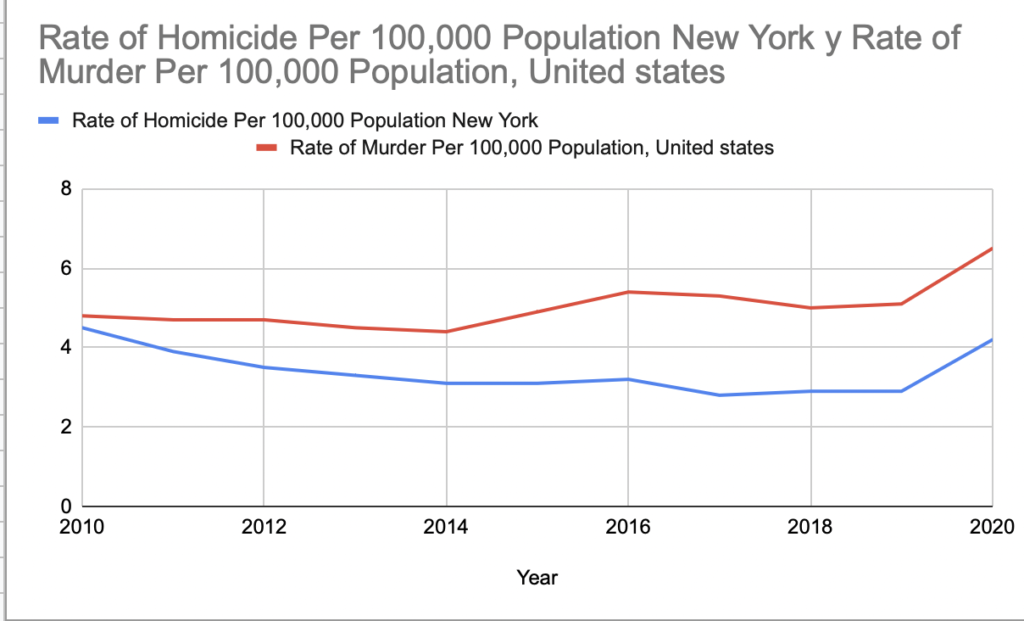
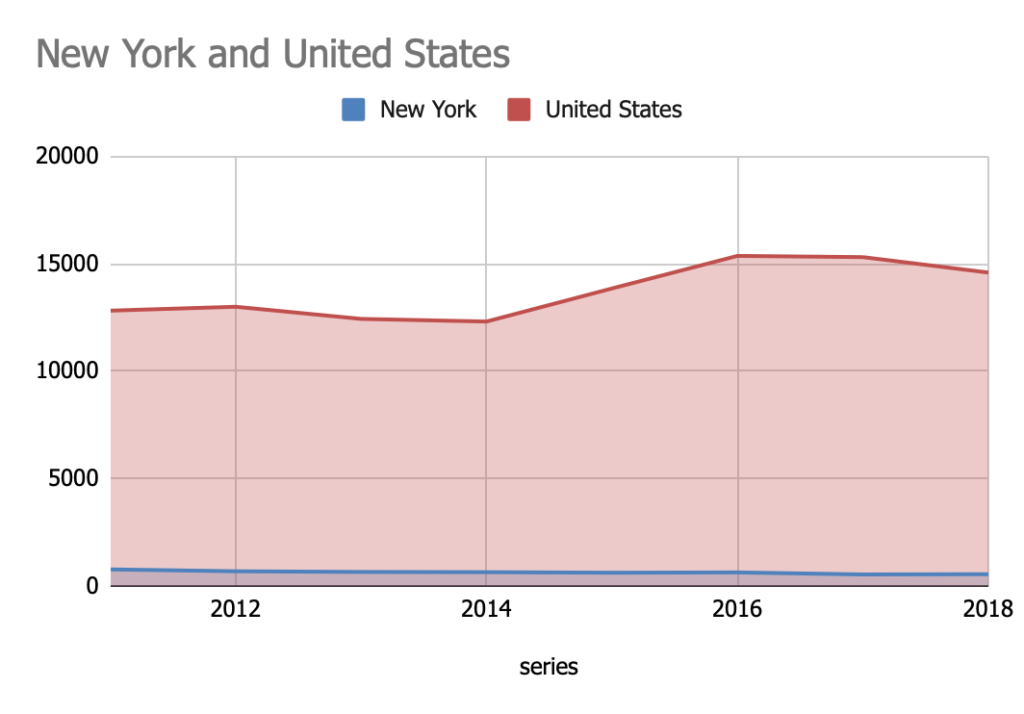
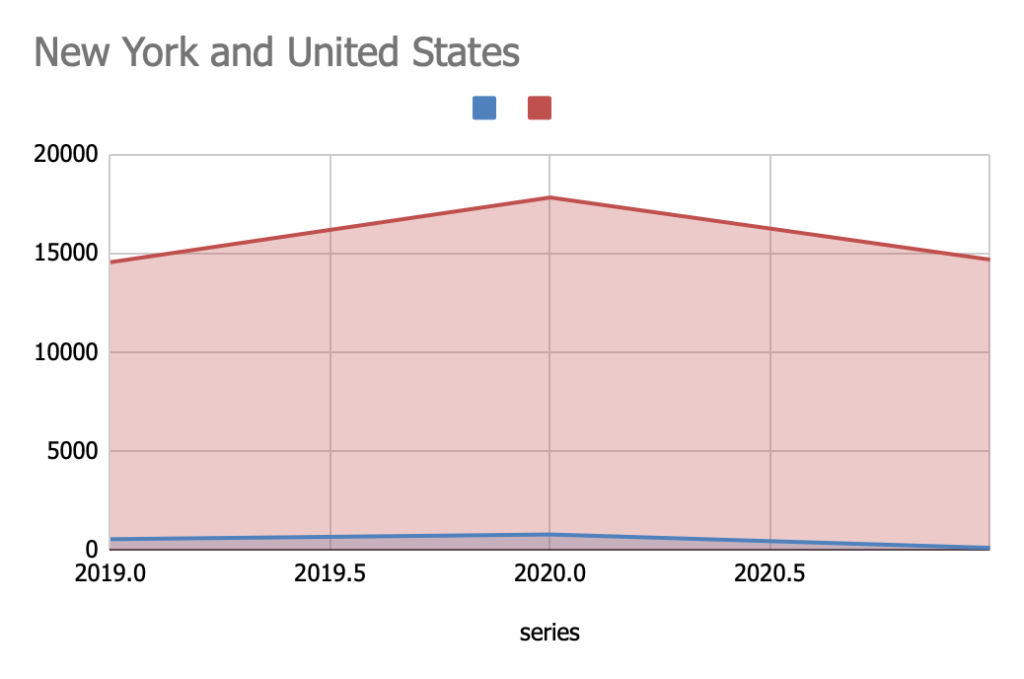
This table help me understand a little more about how the rates are very variable depending on the place and the time. Is very important when you try to have the data about something and these is more organized. The graph help too much because is easier understand and reading the data because you can see and you can’t confused in that, this graphs help you so much understand the percent, the figures and all. It’s very impressive to see how is the difference between the two crimes that I selected, exit a lot difference that the difference is too much and I never imagined how could this change every year and two years ago and how the murder was decreased two years before 2020. I think my hypothesis was supported 50% because I thought the murder can decrease as the years pass, and yes that happens but no too much so that’s why. But I really impressed about the data.

Step 7-Hafsa Abdul-aziz

https://docs.google.com/spreadsheets/d/1vreqiXHwkWTvL_qqaLCt9fYb0H28NQKn1lms8v6kP10/edit?usp=sharing

Research question and hypothesis

Does my research question the homicide rate between 2012-2022 increase in the 81st precinct as time went by ? Based on my hypothesis it would consistently go up and down. So from 2012 to 2018 it increased and from 2019 to 2020 it increased then went back down from 2020 to 2021.

My data came from the FBI UCR data and the 81st precinct.

Here is a graph

The year with the most homicides is 2011 with 769 and from the years 2011 to 2021 it was the highest level and 2021 had the lowest with 124.

Another graph on the homicide trend from 2019 to 2021 it decreased a lot especially from 2020 to 2021.

I was surprised with the results because with New York crime rates extend everyday and in the neighborhood of Brooklyn there’s more crimes than in other parts in New York. With the homicide rates the data that was collected would consistently change a lot.

WEEK 9 yuhai

Durkheim’s definition of anomie pertained to a condition of relative normlessness in a society or social group. Anomie refers to the mental state of a person who has abandoned all social ties and has no standards, sense of continuity, or sense of obligation. People may believe that their demands are unmet by community leaders, that there is no order in society, and that goals are not being achieved. They could also feel hopeless and believe that their friends are unreliable providers of assistance. The reasons for anomie, or normlessness, were explored by American sociologist Robert K. Merton, who found that persons who have no viable ways of fulfilling their objectives are most likely to experience it. If institutionalized measures, those acceptable by the rules of society fail, unlawful means may be adopted because the goals may become so vital. An increase in the focus placed on outcomes rather than methods stresses the regulatory system, which results in anomie. The pressure would lead many people to violate social standards, for instance, if a society compelled its members to amass riches but provided them with insufficient resources to do so. The desire for personal gain and the fear of punishment would serve as the only regulatory mechanisms. Thus, social behavior would become erratic.

step 6 Anthony Vazquez

https://docs.google.com/spreadsheets/d/1oWyVr2_iOaFTHRHgyfSOXAm4NtKAYScotK6SWkQlbqA/edit?usp=sharing

What stood out to me more on the data i have collected theres been a big decline from 2006 to 2020 of property crime and serious crime but then theres been a big increase of property crime and serious crime in 2021. this ties in with how people commit crimes throughout the years within a high population of hispanics.

Step 6

https://docs.google.com/spreadsheets/d/1FPbg1Qearzh EBHRJVPCrmqWK8VrvXWj/edit#gid=1784174845


I was most definitely surprised by some of the data points, mainly 2019’s black population percentage (60.2%) and the single-person household percentage (27.3%). It also surprised me that the foreign-born population of my area was nearly forty percent (39.9%). Regarding the DARE project overall, I feel that these three data points may align with one another when it comes to rising rates of larceny-theft crimes.