This is my unfinished draft. I will post my finished paper in step 10.
https://docs.google.com/document/d/1EC12YncQNodOtMP4uNoXqd9aXKrw1rnYvSGRVMqkepU/edit?usp=sharing
This is my unfinished draft. I will post my finished paper in step 10.
https://docs.google.com/document/d/1EC12YncQNodOtMP4uNoXqd9aXKrw1rnYvSGRVMqkepU/edit?usp=sharing
My research question is, did the homicide rate between 2010 and 2021 increase or decrease in Brooklyn, located in the 62nd precinct?
I gathered data from the NYPD and UCR and was able to see the changes between the National and state data. The chart that is shown below shows how the homicide rate increased in the past 10 years. It is concerning to see that in the past 3 is when the homicide rate was been increasing.

The chart shown below shows the homicide rates of the State of New York. We can see that in 2010 the rates were at its highest and through the years they started decreasing. The numbers decreased for a couple of years but in 2019 the homicide rates started increasing again in New York.

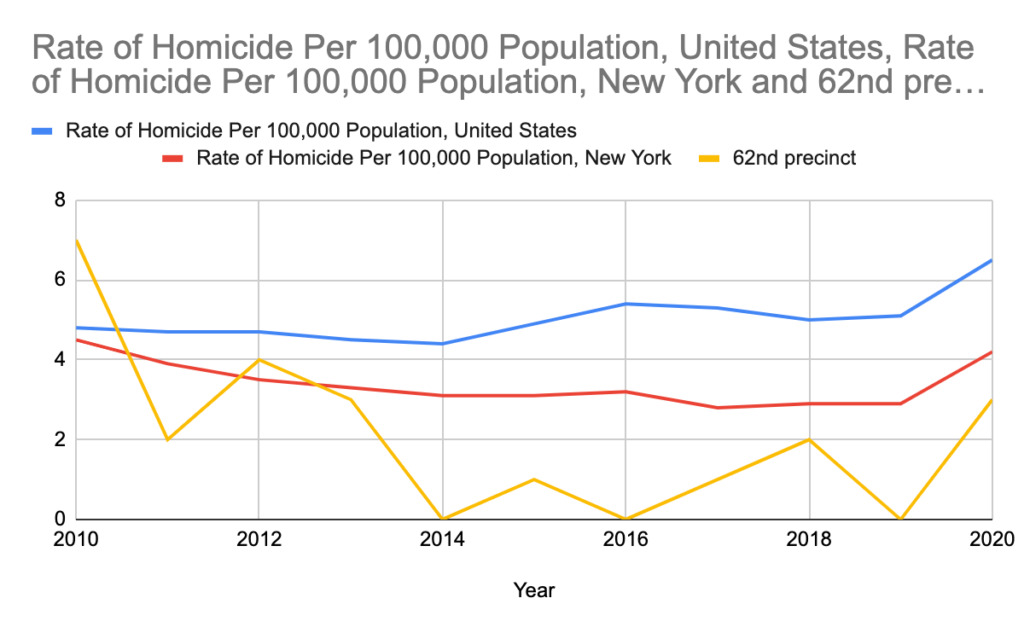
The next chart below, shows the National data, the New York State data , and the 62nd precinct data. We can observe how the 62nd precinct has lowered its numbers in homicide by a lot. The United states and New York show how the numbers have been rising since 2018, meanwhile the 62nd precinct have been low in homicide rates in 2018.

https://docs.google.com/spreadsheets/d/14gUzza5EFI7-xLWjPl2Lb3N8Bj3qbI2WHZ2G6sKJbYw/edit?usp=sharing
It was interesting seeing that throughout the years the Asian population increased while the white population decreased. Although I see and equal amount of both Asians and White people, I am very intrigued as to why both populations increased and decreased by a big difference.
My research question is, when in the previous 20 years did the felony assault rate in precinct 48 go down?
After gathering data from the NYPD, UCR & some precinct level data. I was able to come to the conclusion & gather data that it reached it’s lowest point in 2020, shown in the following graph:

The chart shown above shows data collected from 2000 to 2020. We observe really high rates in the 2000’s & starts to sharply decline in 2011 with 2000 rate of grand larceny cases. This is not as concerning due to it being national data but we can focus on how it changes in the following graph.

The chart shown above is gather data from New York State & shows the trends of grand larceny. As you can observe in the graph the highest rates occur in 2001 with it being at its highest with 2485 in cases. But will later decrease plenty in 2011 with rates of 1974. This shows the lowest case in 2020 with only 1398. A significant decrease is shown throughout 20 years.

The last chart shows the difference of rates nationally & state wise. It is alarming to see how similar the rates are to each other but they do show a decrease over time. Most specifically a decline starting in 2010.
These charts show the significant decrease of Grand Larceny cases but still questions remain such as, “What factors contributed to the decrease of rates?”.
https://docs.google.com/spreadsheets/d/1FY8tVJd62Lp_J9-11NUcF6uz02jIhVf-pyc5opJxOWo/edit?usp=sharing
The data from my neighborhood is exactly what I thought it would be. The demographics seem to be almost exactly accurate, expect I feel there is a higher percentage of caucasians due to seeing a lot in my neighborhood. The poverty rate is quite alarming but seems to be accurate, the surprising part is percentage of income higher than 100,000 which is a little higher than I thought it would be.
https://docs.google.com/spreadsheets/d/1ZzvDmsejcgInDkPaJOGvSG5Ntr69RytfFe-sL0Iu-wQ/edit#gid=0
The graph indicated that crime’s are being committed due to the increase of population, unemployment , and poverty.
https://docs.google.com/spreadsheets/d/1gzitXg1LMF8pSPRDs4tyuqxbgLKMe3QJ5CTfmVfacco/edit?usp=sharing
all of the graphs present in my sheets is all of the factors of why people could commit crimes because the population is increasing over the years. the unemployment rate of people in my neighborhood is another factor that explains that people who aren’t employed could lead to people to commit crimes of robbery, and theft. another factor i used is the population who is 25+ without a high school diploma which explains that people without a diploma cannot find jobs so they will turn to crime.